A globe that rotates. Columns that reveal the real story.
We build interactive 3D presentations where data becomes spatial. See country code domain registrations mapped to capital cities, with column heights showing exactly where each nation stands.


The globe rotates. The data tells the story.
Each feature maps directly to what you see on screen. Rotatable globe, comparative columns, live data. No static charts. No guesswork.

Rotatable 3D globe
Spin to explore. Capital cities anchor each country's data point. Interaction drives understanding.
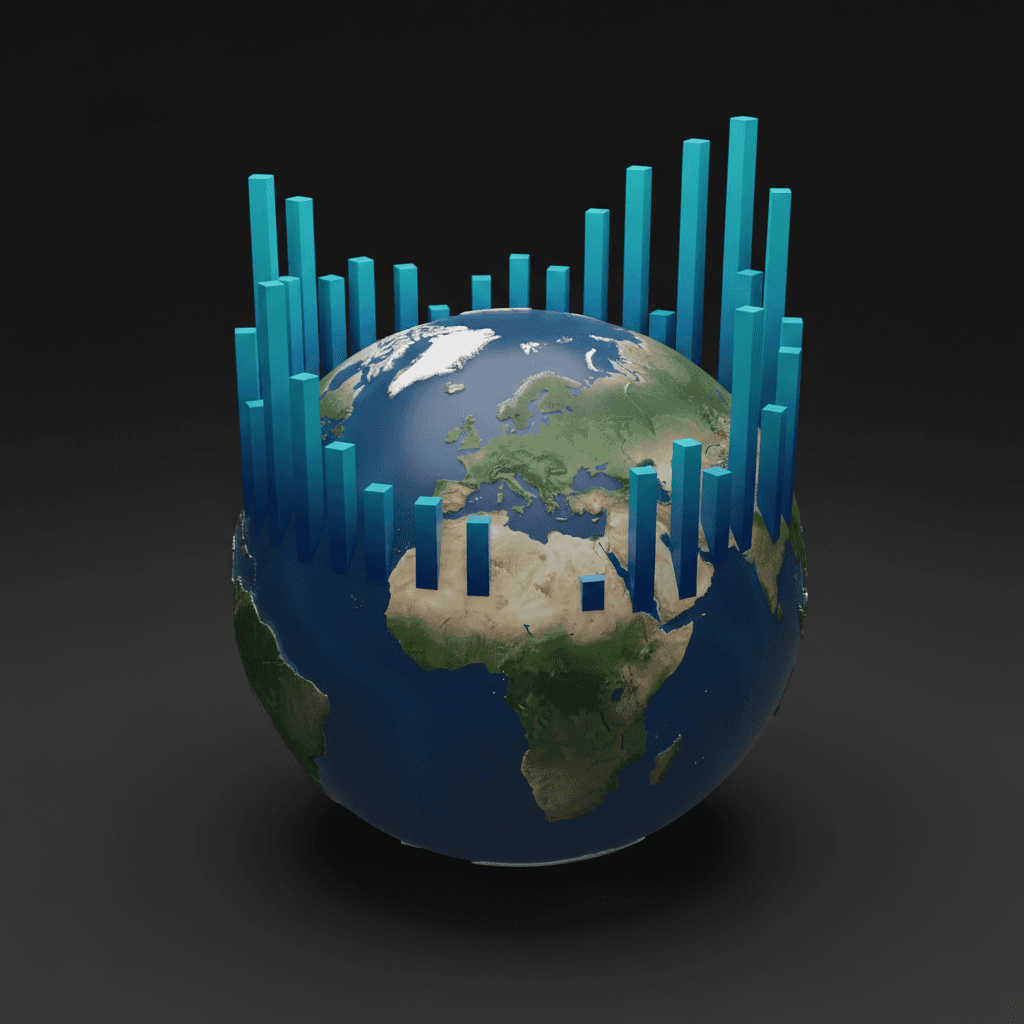
Relative column heights
ccTLD volume mapped to column height. Compare nations at a glance. Scale tells the real story.

Live data mapping
Real ccTLD counts for .uk, .fr, .us and beyond. Every column reflects actual global registration data.
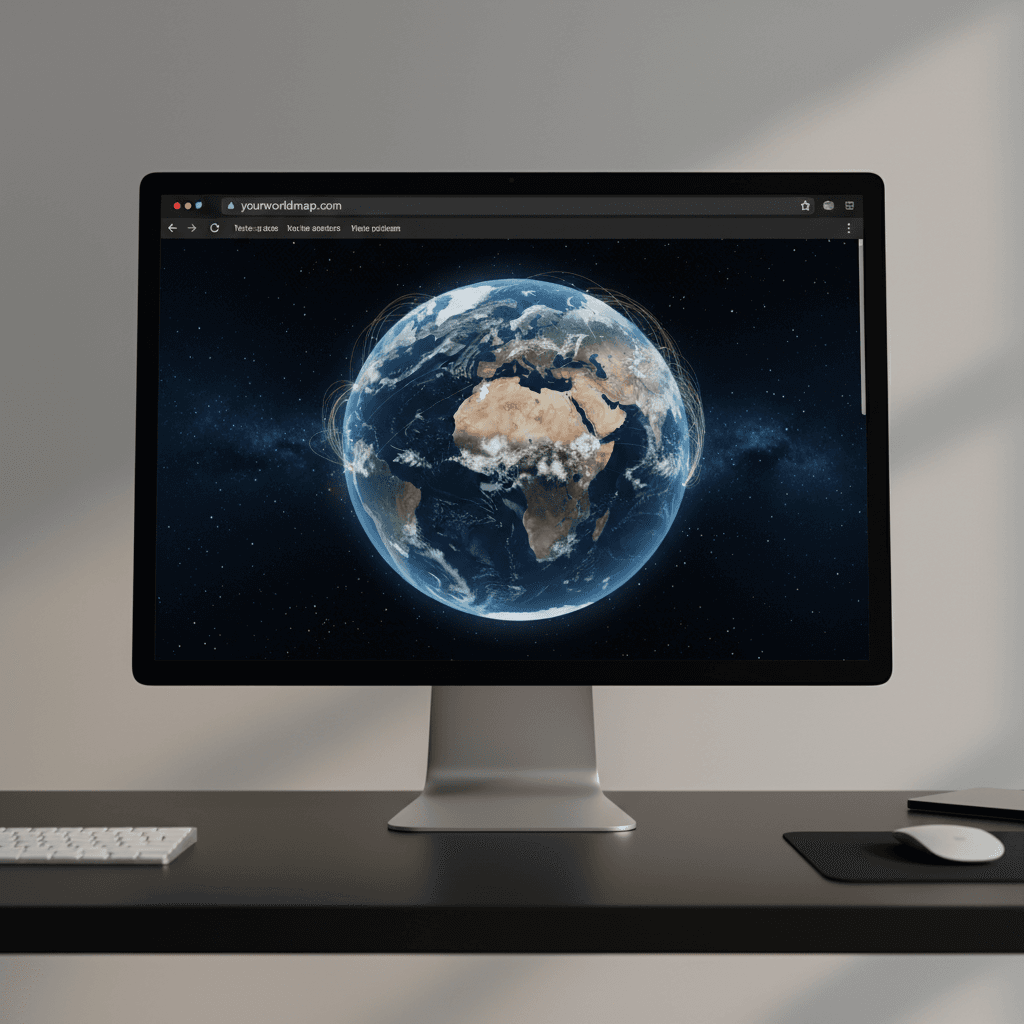
Custom domain publishing
Your presentation lives on your domain. We register it, configure it, publish it live for you.

Full project lifecycle
Interface design, data mapping, domain setup, publishing. We handle every step end to end.

London-made precision
Built in London. Built to last. Interactive visualizations that actually work.
3 studios trusted JMC to map their data
Each one rotated the globe and saw exactly where their domain registrations stood. No guesswork. No static charts.
We needed to show investors where our ccTLD registrations were concentrated. JMC built the globe, mapped the data, and published it live. The column heights told the story instantly.

Alex Whitmore
Operations Director, Domain Registry
The interface is simple to rotate but the data behind it is complex. JMC handled all the technical work without making us feel like we needed a developer in the room.

Priya Kapoor
Product Manager, ISP Infrastructure
We wanted to visualize our regional growth. JMC didn't just build something interactive. They understood the data, mapped it correctly, and delivered it on a custom domain ready to share.

Marcus Chen
Strategy Lead, Internet Services
What our 3D globe projects deliver
Every visualization we build maps real data to precise visual relationships. These metrics show the scope and impact of the work we handle from London.
150+
Countries mapped
We've built data visualizations covering global ccTLD distributions across territories and capital cities.
1
End-to-end project lifecycle
From 3D interface development through data mapping and custom domain publishing, we own every step.
100%
Rotatable, interactive globe
Every visualization we deliver features a fully interactive interface. No static slides. Users rotate and compare.
3
Key data sources integrated
We map ccTLD volumes for regions like .uk, .fr, and .us into relative column heights for instant visual comparison.
A rotatable 3D globe mapped to your data
We handle the full project lifecycle. From technical development to data mapping to publishing on your custom domain.
What does JMC actually build?
We take raw domain data and turn it into a story you can rotate. A 3D globe. Capital cities. Columns that show exactly where each country stands in ccTLD registration. We handle the whole thing: the interface, the data mapping, the domain, the publish.